Kansas has over 90,000 more female voters than male votes (Demographics of Kansas Voters, Part 2)
More males than females in population under age 60 according to census, but more registered females over that age range.
This series attempts to provide new insights about voters and Kansas politics from a deep dive exploring demographics in Kansas voter files and US census data.
Demographics of Kansas Voters Series
Gender: Kansas has 90,000 more female voters than male voters.
Political Parties: Kansas Democratic Party has 105,000 more females than males
Counties: Comparisons of Kansas county census populations to voter rolls.
This second article breaks down the total Kansas voter registration by gender as defined by the field cde_gender in the Kansas voter file. Data from Johnson and Sedgwick Counties will also be explored.
The next article will continue the breakdown by gender and political party, which is very interesting.
Overview of findings for this article:
There are more males than females for age intervals under 60 years, but females in this range have more registered voters. Do we need targeted efforts to encourage male registration for parity with females?
Females have more voters than males in all age intervals except for slight “loss” in the 18-19 interval.
In general, female voter registration rates exceeds male voter registration rates for all age intervals.
Statewide
The 2022 ACS 5-year estimate from the US Census says the Kansas statewide population is 2,935,922 with with 2,234,510 of voting age (18 or over). The census breaks down this voting age population into 1,119,784 females and 1,114,726 males.
A recent Kansas voter file with 1,975,884 voters shows 1,027,582 females, 937,011 males, and 11,291 voter who did not select a gender.
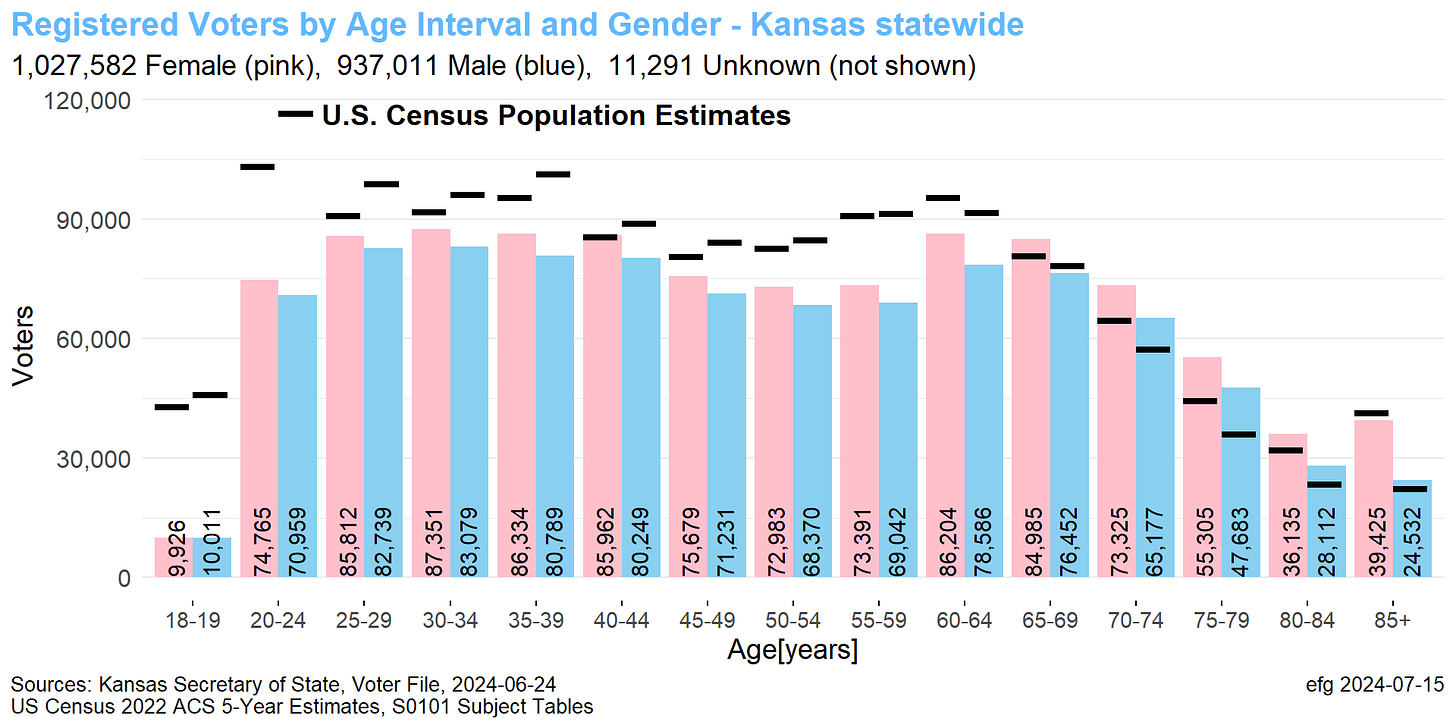
The barplots below compare these male and female voters from the voter file with the the male and female census estimates by age interval.
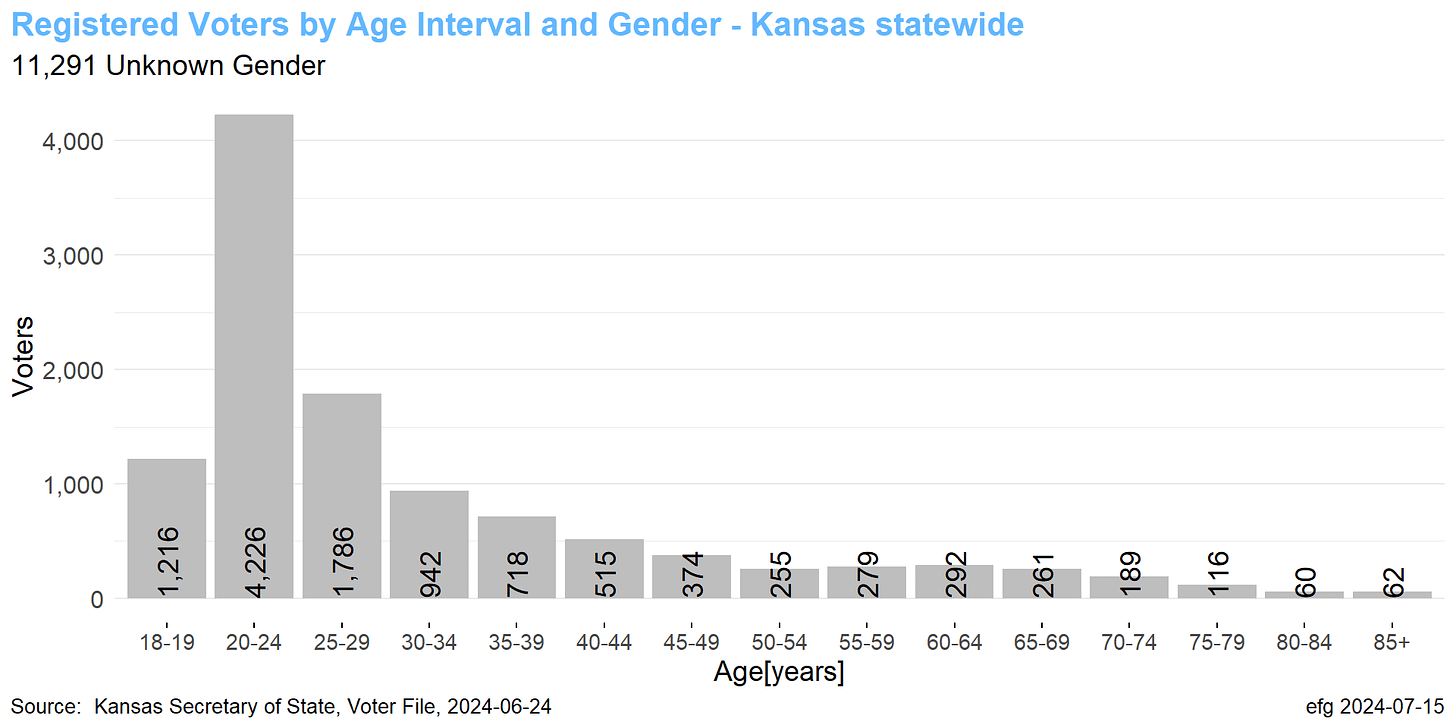
A separate barplot below breaks out the 11,291 voters not specifying a gender by age interval. These “unknown” numbers are less than 1% of the male or female numbers and would be nearly a flat line if not plotted separately.
Barplots
The US Census defines 5-year age intervals, which were adapted for comparison against Kansas voter data. (See see Data Sources comments from the part 1 article for more information including how the two-year 18-19 age interval was computed.)
The vertical bars below represent the number of registered voters in each of the 15 census intervals.
When looking at total voters in the first plot below, the bars are divided into two parts: the active voters in blue, and the inactive voters in grey when looking at all voters.
When looking at voters by gender in the second plot below there is a pink bar for female counts, and a blue bar for blue counts, for each age interval.
Each thick black horizontal line shows the 100% registration level for an age interval based on census population estimates. There are separate census estimate by gender for each age interval.
Voters by Age Interval
Let’s start this discussion with a review of the total registered voter counts by age interval, which was discussed in the Part 1 article.
Voters by Gender and Age Interval
The registered voters in each age interval in the plot above are split by gender.
The plot below then shows the separate estimates of gender for each age interval.

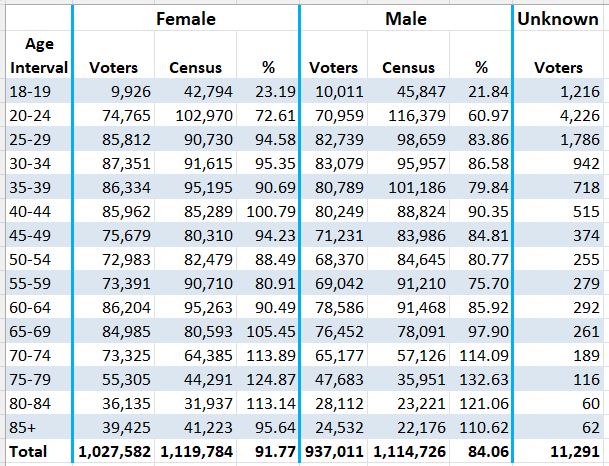
The data for this plot are shown below, which may be a helpful reference for the following comments about the plots and data.
Let’s look at the plot and data above three ways by age interval:
Census estimates (horizontal black lines). According to census estimates there are more males than females for age intervals under 60 years. For intervals 60 and above, the census shows more females.
Voter numbers (pink/blue bars). Females have more voters than males in all age intervals except for the 18-19 interval. While there are more males than females in the 18-19 interval, the census data indicate females still have a higher percentage registered, 23.2% for females vs. 21.8 for males.
Percentage registered (see data below). In general, female voter registration rates exceeds male voter registration rates for all age intervals, except for the 100+ percentage intervals 70-74 through 85+. For these intervals males have a higher percentage over 100%. For example, interval 75-79 males shows a 133% registration rate, while females only have a 125% rate. This suggests there is a more severe problem in not removing voter bloat for males than females.
“Unknown” Gender
With the active LGBTQ social contagion in recent years, the number of registered voters not specifying a gender has grown to over 11,000, especially in the 20-24 age interval.

These 11,000 voters cannot be compared with census data at this time, which means the voter data in the chart above are slightly underreported, especially for the 20-24 age interval.
A retrospective study of the evolution of the “unknown” chart above over the last 20 years might be interesting.
Data
Selected Counties
Johnson County
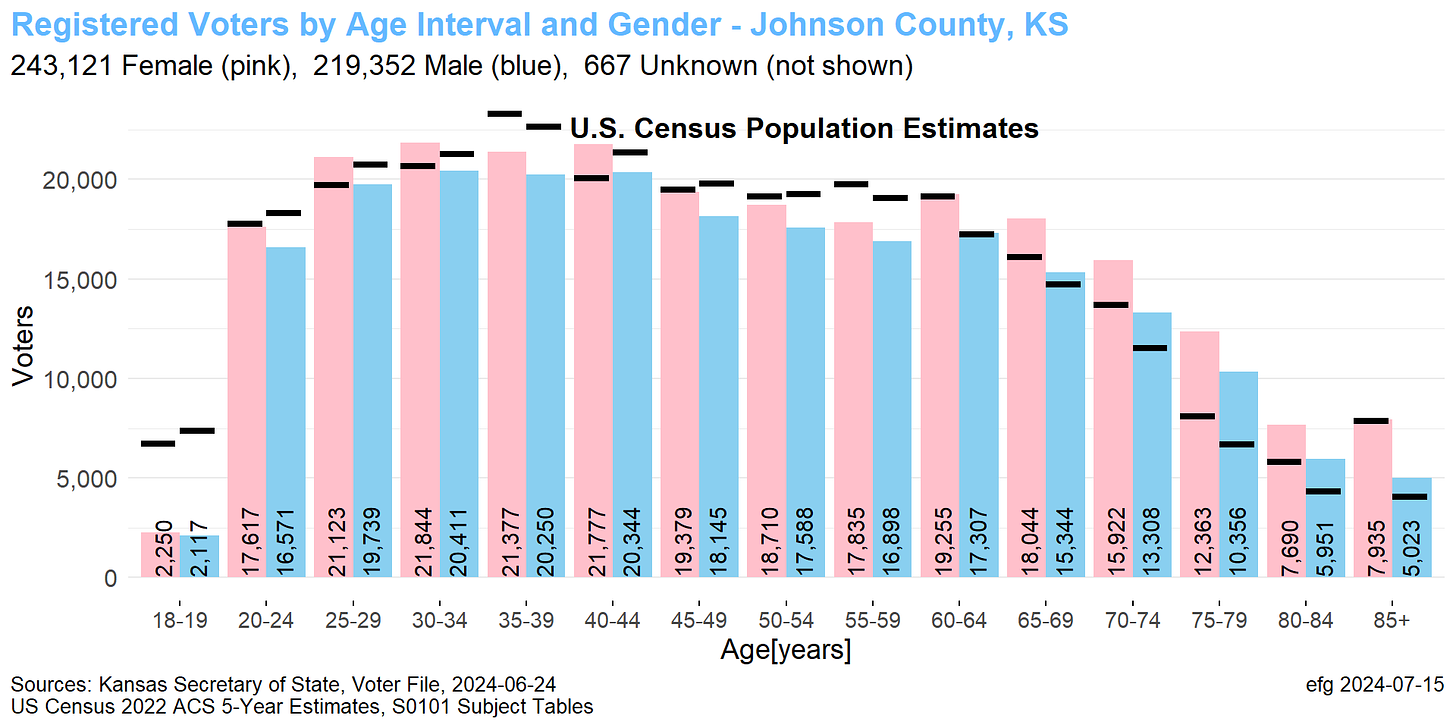
Female voter registration for several age intervals in Johnson County is higher than the census voting age for females. This happens for male intervals only for older ages, 60 and above.
Sedgwick County
Data Sources
Download Excel files with Male-Female ACS 5-year US Census estimates for Kansas statewide and all counties:
Also see Data Sources comments in the part 1 article.


