Comparisons of Kansas county census populations to voter rolls
Final article in series about Demographics of Kansas Voters
This series attempts to provide new insights about voters and Kansas politics from a deep dive exploring demographics in Kansas voter files and US census data.
Demographics of Kansas Voters Series
Gender: Kansas has 90,000 more female voters than male voters.
Political Parties: Kansas Democratic Party has 105,000 more females than males.
Counties: Comparisons of Kansas county census populations to voter rolls.
This final article looks at some of the differences in comparisons of voter rolls to census voting age population in Kansas counties.
This article explores these topics:
Counties with large universities
County inactive voter rates
County voter registration rates
Counties with the most seniors
Counties with large universities
What explains the “gaps” in voter registration rates for intervals 18-19 and 20-24 in counties with large universities? These gaps can also be seen in the statewide plot (see first article in series).
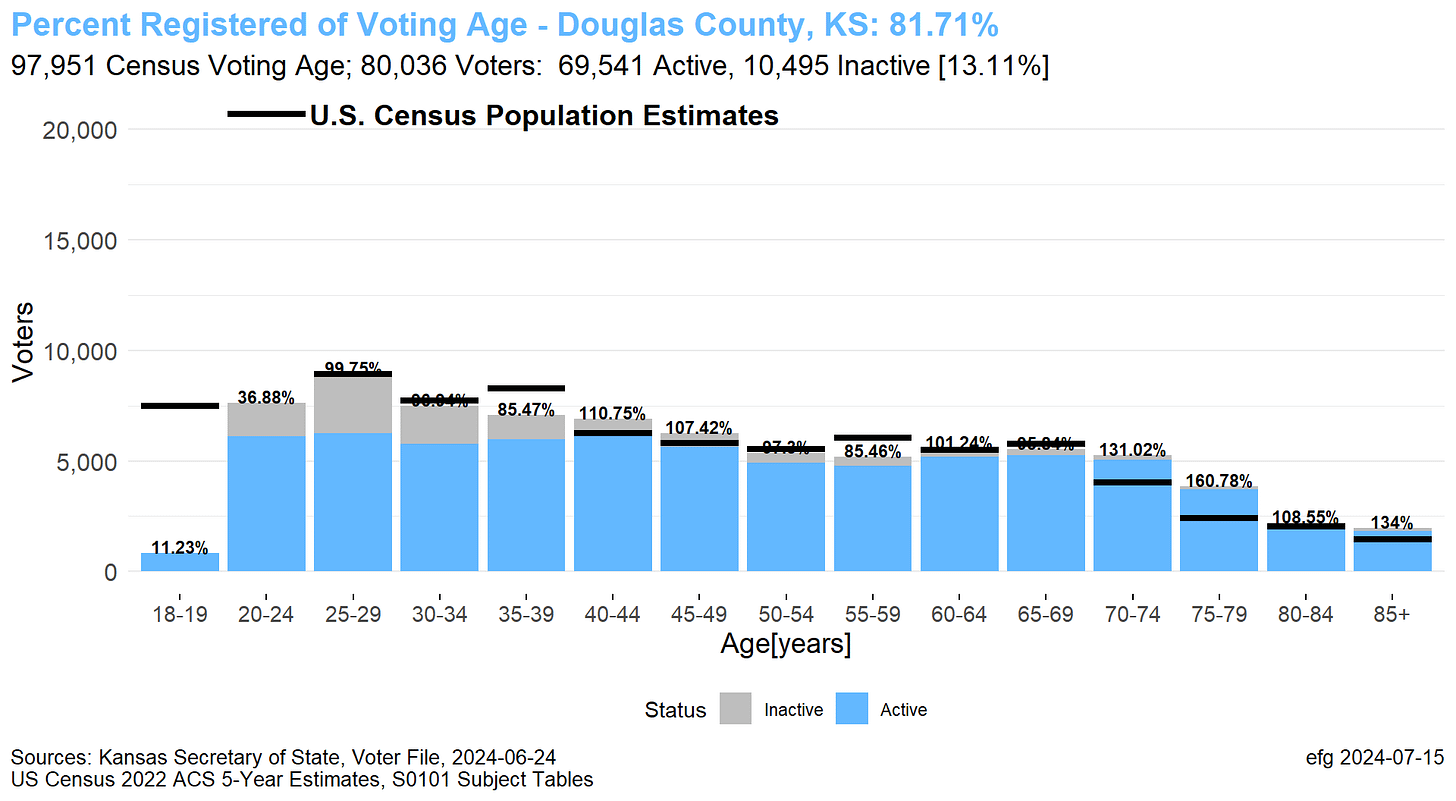
Plots for Douglas County (KU) and Riley County (K-State) are shown below, but other counties with universities show similar patterns.
Crawford County (Pittsburg State University)
Ellis County (Fort Hays State University),
Lyon County (Emporia State University)
These plots show huge gaps between the voter registration bars and the population estimates for age intervals 18-19 and 20-24. These gaps are much larger for these two younger age intervals than older age intervals.
What explains these gaps? Do census numbers around universities include out-of-county, out-of-state, and out-of-country international students that do not vote? Do the gaps represent a number of non-citizens who are not eligible to vote?
Douglas County: University of Kansas
Why are the registration rates so low in the 18-19 interval (11.23%) and 20-24 interval (36.88%) in Douglas County when all older age intervals show near 100% registration (with seven intervals over 100%)?

Riley County: Kansas State University
Why are the registration rates so low in the 18-19 interval (5.52%) and 20-24 interval (23.15%) in Riley County when all older age intervals show 80% or higher (with six intervals 100+%) registration rates?
Riley County has the lowest overall registration rate in the state: 63%. But most of this low percentage is caused by the 18-19 and 20-24 age intervals.
The online publication 24/7 Wall St lists Riley County as the youngest in Kansas.
The median age in Riley County is 25.1 years, making it the youngest county … in Kansas. For context, the median age across the state as a whole is 36.7.
County Inactive Voter Rates
See a county map of inactive rate in this recent article:
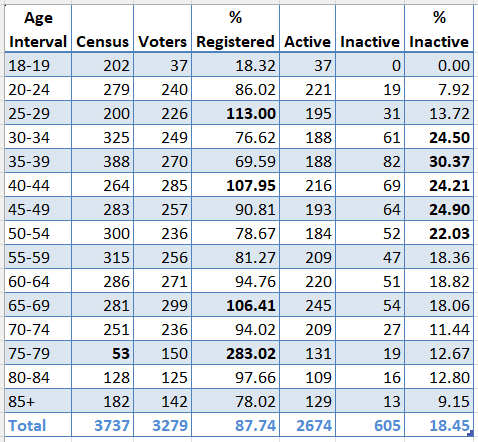
Highest Inactive Rate: Stevens County, 18.45%
The grey rectangles of high inactive rates across a broad range of age intervals suggest list maintenance has not been performed in quite some time in Stevens County.
Other counties with similar high inactive rates include Rice (17.28%) and Sumner (16.78%).
This table shows all the numbers used to great the chart above.
The high inactive rates for intervals, 25-29, 40-44 and 65-69, force the registration rate to over 100%.
Why is the census estimate for age interval 75-79 so low? Is this census estimate wrong? This unusually-low value explains the 283% registration rate for this interval.
Four intervals (ages 30-54) show 20% or higher inactive rates.
Lowest Inactive Rate: Wilson County, 0.35%
Wilson County voter rolls show the lowest inactive rate in the state, 0.35%.
But very low inactive rates can be tricky:
A near-zero inactive rate might be explained by recent list maintenance and the removal of inactive voters.
Or, is it possible list maintenance is not happening, and more voters should be tagged as inactive?
Other counties with very low inactive rates include Hamilton (0.53%) and Doniphan (0.59%).
County Voter Registration Rates
Highest Registration Rate: Bourbon County, 117%
The high registration rates by age interval seem to be explained by low census numbers that have been exceeded. Perhaps census estimates are not accurate and too low for Bourbon County? Is there another explanation?
Other high registration rate counties include: Meade (115.09%) and Phillips (102.72%). Like in Bourbon County, the census data looks suspect in these counties, too.
Lowest Registration Rate: Riley County, 63%
Riley County has the lowest registration rate of 63% (see chart above in the section about universities).
The chart below is for Stanton County, which has the second lowest rate with 67%.
Even with such a low registration rate, Stanton County shows five age intervals with registration rates of over 100% based on census voting age data.
Counties with most seniors
The online publication stacker lists 50 Kansas counties with more than 20% of the population aged 65 or older. The “top” two are Jewell and Elk Counties.
Jewell County
stacker shows Jewell County has 30.5% aged 65 or older and a median age of 52.8 years old.
The modal age interval for Jewell County is the 70-74 age interval.
The comparison of voting age to registered voters in Jewell County shows the census estimate for age interval 70-74 is lower than the number of active voters. Is the census data or the voter data correct?

Elk County
Elk County has 28.8% aged 64 or older and a median age of 52.3 years old.


