Johnson County has 102% of census voting-age population registered to vote
Federal law blocks faster cleanup of voter rolls
Updated Nov. 6.
Voter registration closed in Kansas three weeks ago on Oct. 15.
A voter file obtained from the Secretary of State’s office on Oct. 22 was used to create the bar plots and statistics below. Since registration had been closed for a week, the voters in this file should be close to the eligible list of voters for Tuesday’s election.
An earlier article gives information about the US Census American Community Survey of state and county population estimates by age interval and gender.
State of Kansas (91% registered)
When compared with US Census ACS 5-year estimates of voting age population, Kansas has an overall voter registration rate of 91%, with some older age intervals having 100+ registration rates.

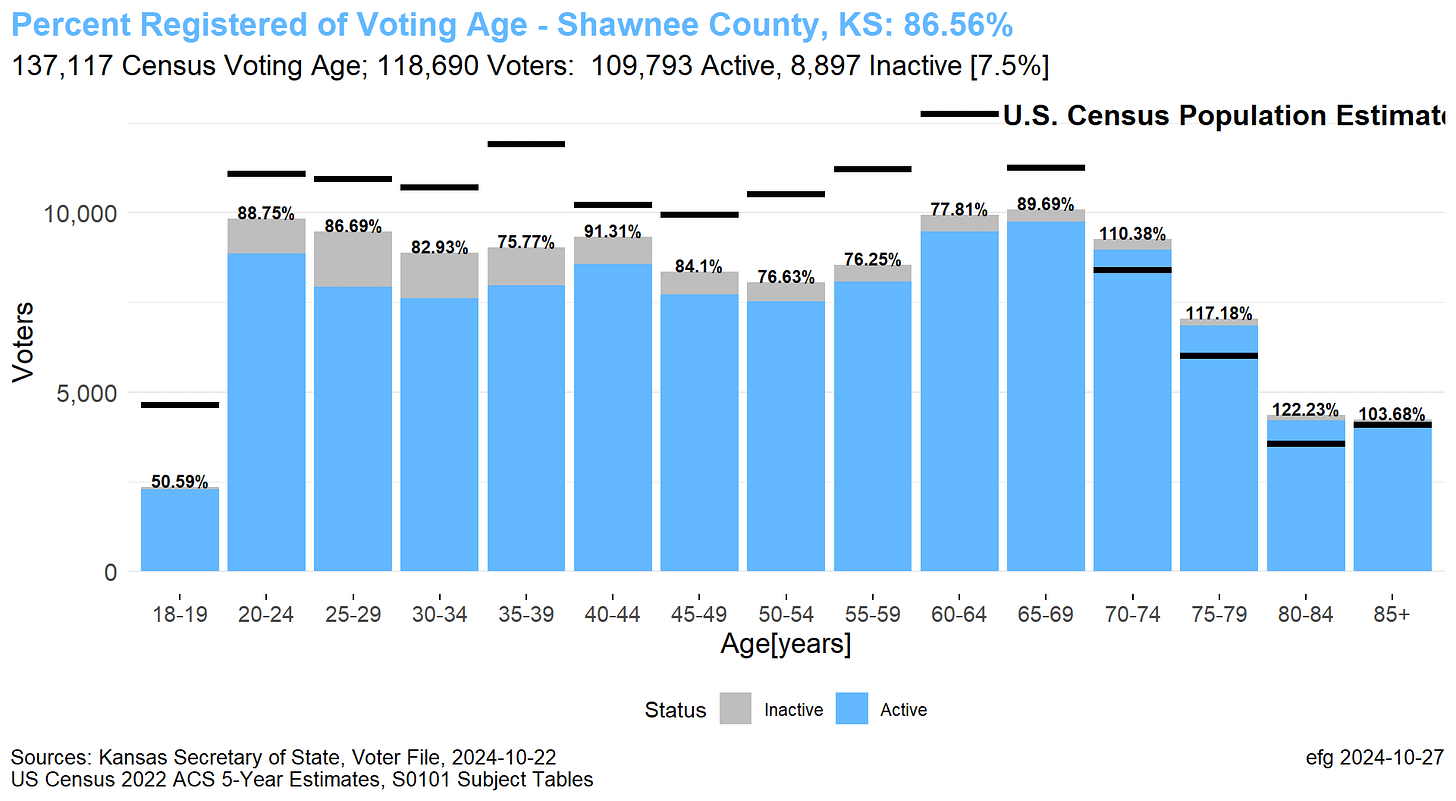
The blue and grey bars reflect the “active” and “inactive” voters in each age interval, but the words “active” and “inactive” are misleading.
Election offices usually have valid addresses for the “active” voters, which are the most likely to vote.
“Inactive” voters should be called “invalid address” voters to properly reflect their problem. More voters are marked “inactive” for an invalid address than for not voting. Without a known address, how can an election office know which ballot an inactive voter needs?
Inactive voters, who have already missed a federal election, can be removed from the rolls after missing a second federal election. According to the Kansas Election Standard:
“Inactive” is defined in the National Voter Registration Act and Kansas law as a person whom the US Post Office states has moved out of the county and who has been mailed a confirmation notice. The person’s registration may be canceled after the second succeeding federal general election following the mailing of the confirmation notice. Inactive voters are designated as such on the statewide voter registration database.
How are confirmation notices sent to people who have moved with no known forwarding address?
Informal studies suggest perhaps 10% of inactive voters show up for presidential general elections.
The black horizontal bars show the census population levels for each age interval. Below age 65, the black bars hover over the blue/grey bars. This small gap reflects the number of people in the interval that are not registered to vote.
Above age 65, the black bars overlay the grey or blue bars, since these intervals have more voters registered than census estimates suggest.
US Census 5-Year ACS estimates also provide breakdowns by gender. The plot below shows Kansas has more female voters than male voters in all age intervals -- but census data show more males than females roughly below age 60.
Males are underrepresented in the voting population! Groups that target underrepresented groups, should target male voters!
For a given age interval below, note the black census bars are higher for males than the corresponding female bars until age 60.
Johnson County (102% registered)
Tracking the mobile, urban population in Johnson County is a challenge, which is reflected in its 102% voter registration rate. Some age intervals are well above above the 100% mark.
If the current inactive voters were purged, a 92% registration rate would be better, but still a bit high.
We need Congress to take this issue seriously and provide better ways to keep voter rolls updated. The current glacially-slow process can take 5 to 10 years — or more — to remove people who have moved without notifying the election office.
Other Counties
Here are stats for other Kansas counties: SG (88%), SN (87%), WY (77%), DG (85%) and LV (90%).
Sedgwick County (88%)
Shawnee County (87%)
Wyandotte County (77%)
Douglas County (85%)
The Douglas County chart is curious.
The census identifies college age students in age intervals, 18-19 and 20-24, but many of the KU students must be registered to vote at their home addresses outside Douglas County based on the chart below.


The results for Johnson county in the Presidential race were appalling. As of the time I checked, Harris had 175, 998 votes to Trump's 148,756 votes.
Registrations for October were: Democrats: 154, 661, Republicans 194,499.
So Harris got about 20,000 MORE votes than there were registered democrats, but Trump got over 45,000 FEWER votes than there were registered Republicans.
Overages in registered voters create concerns about results, which is what those who control government from outside of government want.