How will 418,000 Advance Mail Ballot Applications sent to "active" voters change turnout in Johnson County in November?
Clues are in County Election Turnout Curves by Age and Party from Local General Election from 2021
Turnout in local elections is often fairly low.
Turnout for the Nov. 2021 local election in Johnson County was about 25% with only about 112,000 showing up to vote.
Will the 418,000 Advance Mail Ballot forms sent to all “active” Johnson County voters make a difference this this year?
Will the mailing make a difference for some ages and not others?
Will the mailing make any difference by gender of voter?
Post-election Nov. 2023 plots like shown below for the Nov. 2021 turnout will answer these questions.
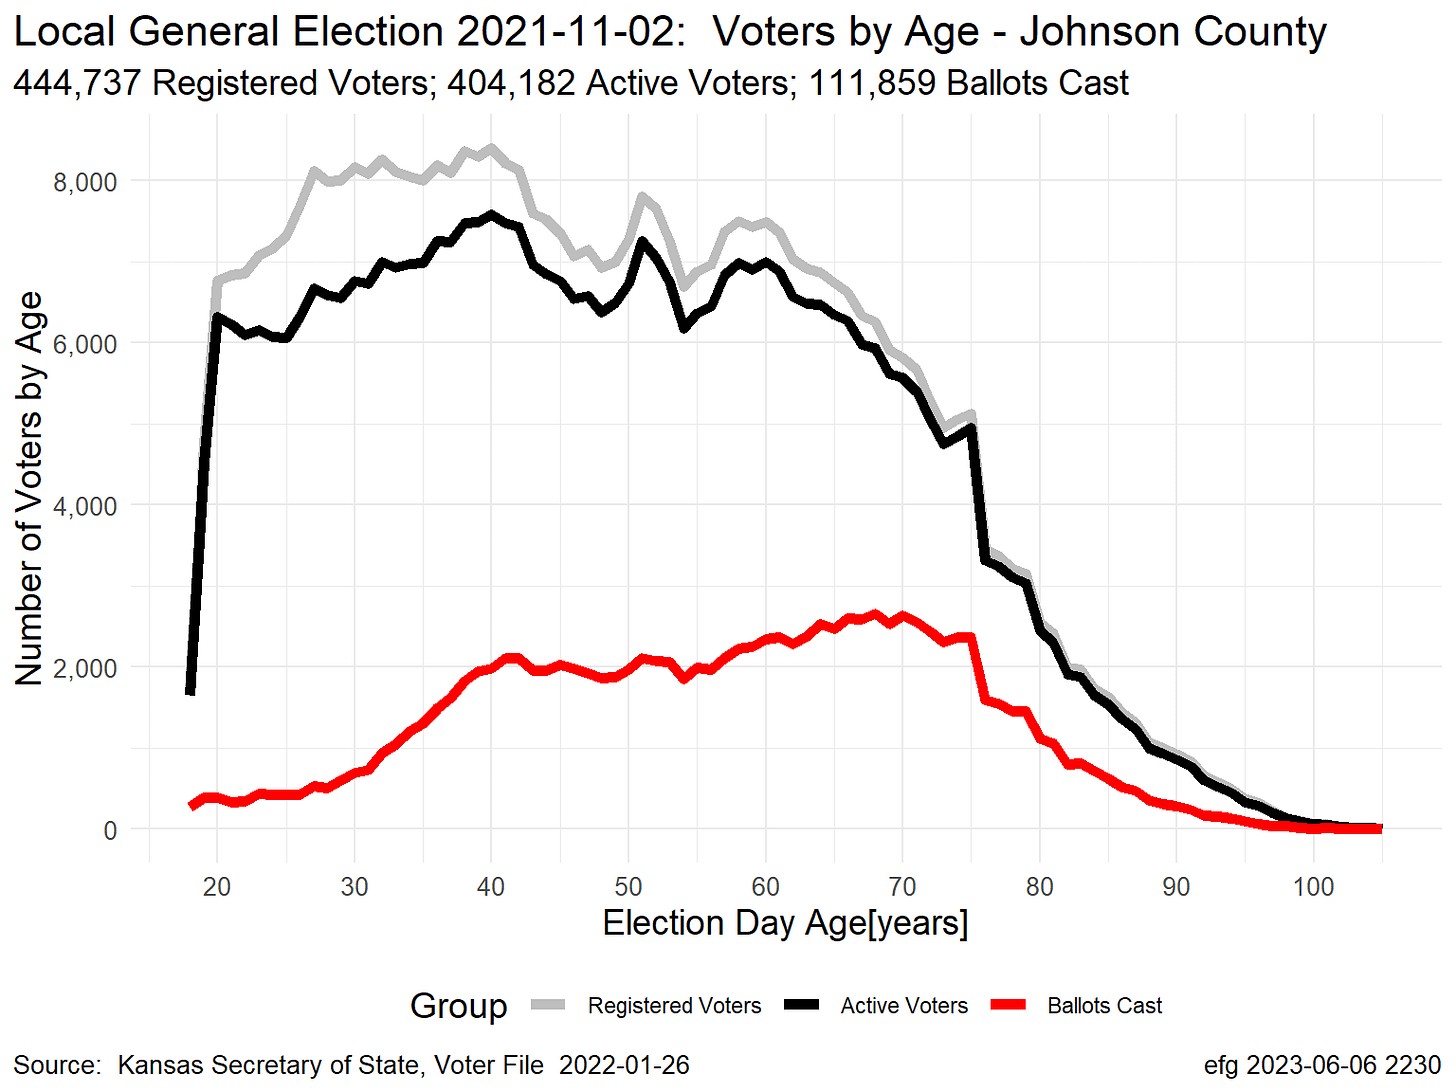
Turnout by Age in 2021 JoCo General Election

The grey curve above shows the number of registered voters for each year of age from 18 to 105.
Some of these voters are tagged by the election office as “inactive” when the election office cannot contact them by mail — often because the voters no longer live at the address the election office has on file. However, these “inactive” voters can vote if they show up.
Do we have sufficient check and balances in place when “inactive” voters show up to vote, especially in district races that change by address? Shouldn’t “inactive” voters be required to cast provisional ballots — especially in district elections — that are only counted when addresses have been verified?
After subtracting the “inactive” voters, the remaining voters are the “players” in the “election game.” The “active” voter counts by age are shown by the black line.
These “active” voters have have a range of likelihood to vote — from not likely to very likely to vote. The likelihood to vote can be explored using voting history in voter files that are sold by the county election office or the Kanas Secretary of State.
The red curve represents the actual number of voters by year of age voting in the local general election in 2021.
Turnout is highest for voters roughly 40 to 75 years old in the 2021 local election, which is common for local elections.
The area between the black and red curves represents the large number of voters not participating in local elections!
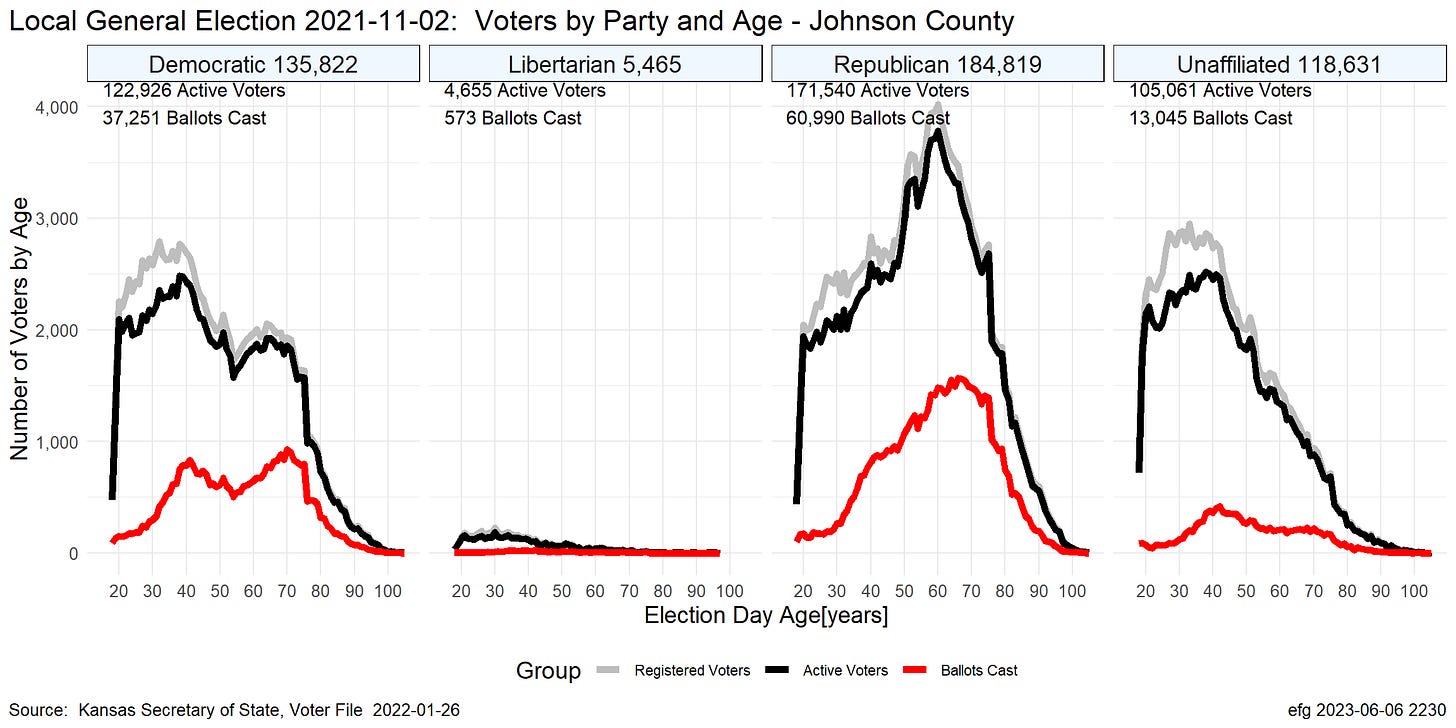
County Turnout by Party and Age

Republicans cast over 10,000 more votes than Democrats and Unaffiliated voters combined in the “non-partisan” local election in Nov. 2021.
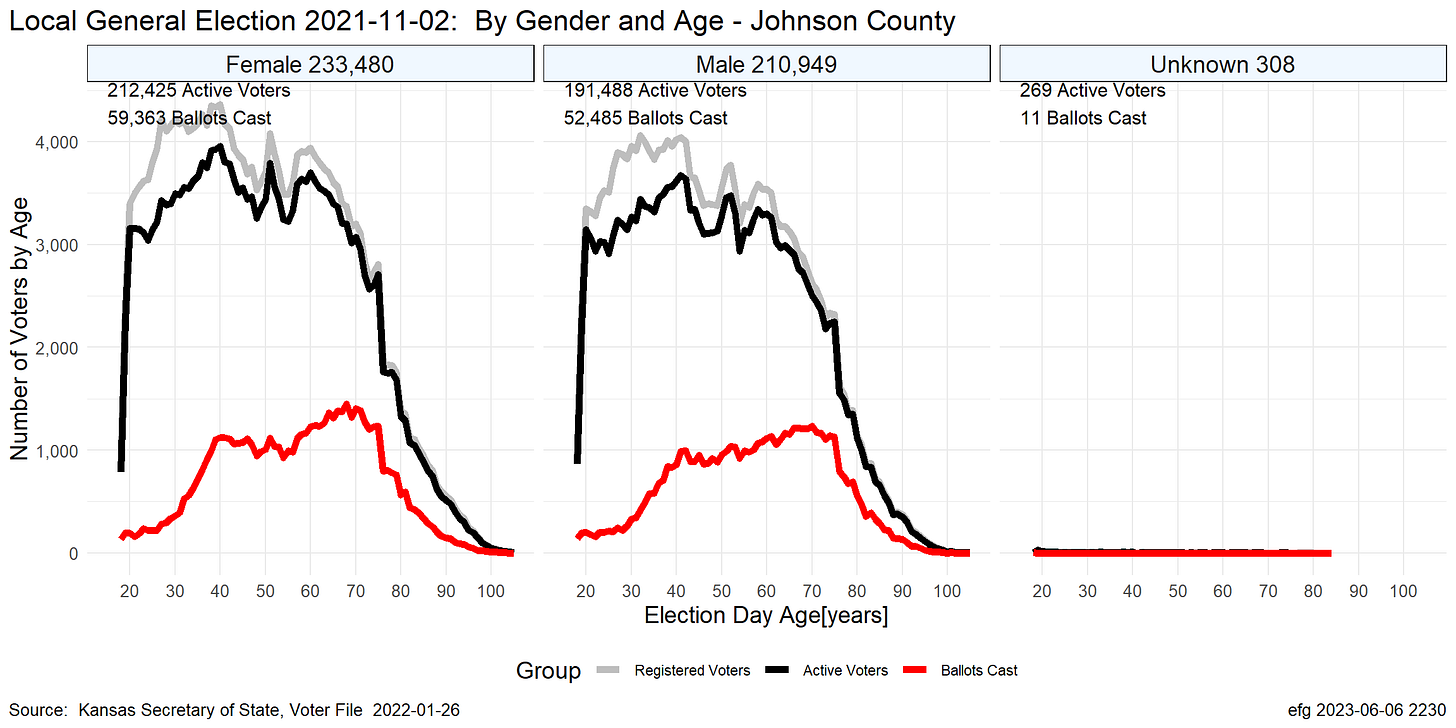
County Turnout by Gender and Age

Females outnumbered males by more than 22,000 in Johnson County for the 2021 local elections, which resulted in only about a 7,000 vote advantage.
Limitations
Official JoCo Results from the Nov. 2021 election show 111,761 ballots cast and 53 blank ballots from a total of 442,236 registered voters — a turnout of 25.3%.
The turnout curves above were created using voting history from a statewide voter file obtained nearly three months after the election.
The voter file is dynamic and changes as people register for the first time, move and re-register with a new address, or die and are removed. The numbers represented in the plots above are quite close to the original election-day numbers but are not exactly the election day counts.


