Analysis of Pupil-Teacher Ratios in Kansas School Districts
How has the Pupil-Teacher Ratio changed by year since 2007?
Pupil-Teacher Ratio data from the Kansas Department of Education show how class size has changed over the years for the nearly 300 public school districts in the state. Data and charts of this information are shown below.
In addition to the pupil-teacher ratio, these files provide the Full-Time Equivalent enrollment figures, and a breakdown of counts of education professionals:
Licensed Personnel
Special Education Teachers
PK-12 Teachers
The Pupil-Teacher Ratio is computed by dividing FTE Enrollment by the number of PK-12 Teachers for each school district, and overall for the state.
Reproducible Research
Complete data provenance is provided. Instructions below show how to download the data from the Kansas Department of Education, or use files already downloaded and stored on GitHub. Electronic notebooks using the R language document all processing and analysis steps, which are also stored on GitHub. This article is an overview of the process.
Data files and R Studio Notebooks can be found on GitHub in the Pupil-Teacher-Ratio folder.
Authoritative Data Source
Start on this Kansas Department of Education Data Central page:
KSDE Data Central - Kansas Education Reports
Select School Finance Reports Warehouse.
Make these selections:
Select report format: Excel
Report type: Expenditures Per Pupil
Report Description: Shows the unaudited FTE (Full Time Equivalency) of Licensed Personnel, Special Education Teachers, and PK-12 Teachers then gives the pupil-teacher ratio for all districts including state totals. See Report Summary for more information.School Year: pick one “2007 - 2008” through “2020-2021”
Press “Display Report”
Save each of the 14 Excel files using a name such as Pupil-Teacher-Ratio-yyyy-yyyy.xls
The analysis process below involves:
Combining all the yearly Excel files together to create a single “wide” dataset showing values by school year by school district.
Exploring each key field using density plots to look for consistency in the data, and possible outliers.
Displaying state summary of time series of Pupil-Teacher Ratio over school years 2007-2008 through 2021-2022.
Data Exploration
Notebook 10-Pupil-Teacher-Ratio.html on GitHub shows explorations of the data and creation of several time series graphics.
Section 2.4 of the Notebook shows the utility of the map_dfr function from the R purrr package in reading and combining all 14 Excel files in one step, to enable analysis of all years. Section 2.5 shows Sample Data.
Density Plots
A quick way to evaluate the distribution of a quantity, and sometimes determine if there are outliers, is through a density plot, which is similar to a histogram. This step is to ensure the quality of data and to better understand nuances in the data.
The goal is to understand the consistency, variation and extreme values, and not-so-much the number of school districts in any particular interval.
If a density plot is “normal,” then mean and standard deviation statistics are meaningful. If not, non-parametric statistics like median and interquartile range are more appropriate. Interpretation of the “log normal” data is more complicated because of the huge range that can be present.
The density plots below are from the most recent school year of data, 2020 - 2021.
See Section 3 in the Notebook.
Licensed Personnel
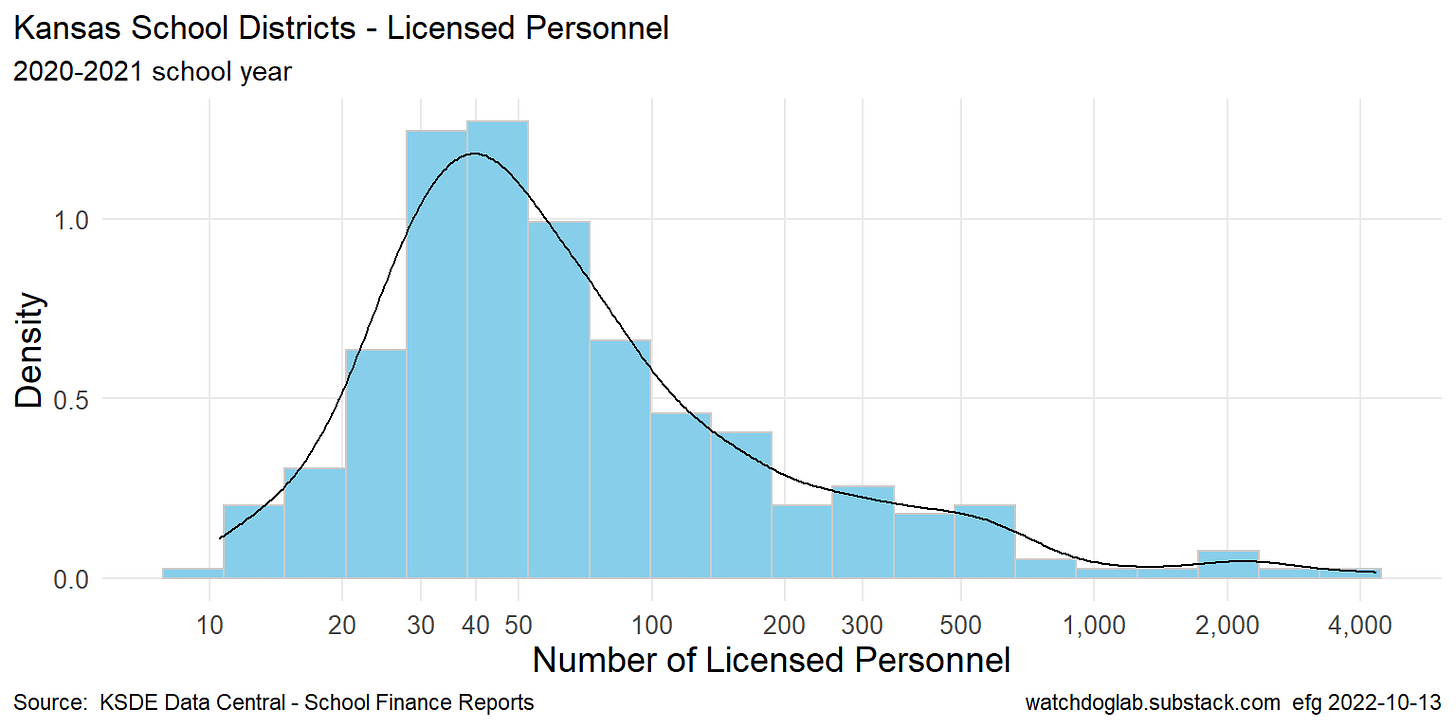
School districts in Kansas range from very small to very large. The log-scale shown above accommodates the wide range in a single plot, which is roughly log-normal.
See this Excel file with Licensed Personnel numbers by school year for all public school districts in Kansas:
Special Education Teachers
This density plot shows wide variation in the number of Special Education Teachers across all school districts, but is very different from the density plots for Licensed Personnel (above) or PK-12 Teachers (below).
In particular, a number of Kansas school districts have very few special education teachers — often under 10.
PK-12 Teachers
The PK-12 Teacher density plot is similar to the Licensed Personnel plot but with slightly lower numbers.
Full-Time Equivalent Enrollment
The FTE density plot is roughly log-normal.
Pupil-Teacher Ratio
Pupil-Teacher Ratio = FTE Enrollment / PK-12 Teachers
Many school districts in Kansas enjoy a pupil-teacher ratio between 10 and 12, but a few have a much higher ratio.
These differences can be explored in the following Excel file by sorting by the values for a particular school year. This file shows pupil-teacher ratio values for the nearly 300 school districts in the state over school years 2007-2008 through 2021-2022.
Here are the school districts with the largest and smallest Pupil-Teacher Ratios in the 2021-2022 school year and how those values have changed over time:
Time Series Showing Changes Over Time
See Notebook Section 4.
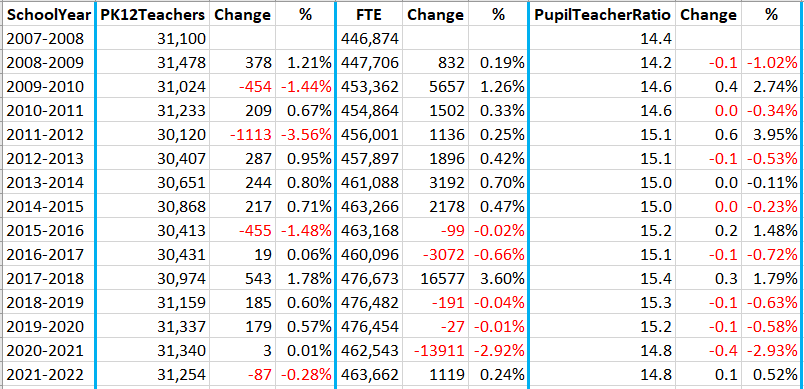
Here’s a summary showing changes and percent changes by year, which are discussed with the next two plots.

Full-Time Equivalent Enrollment
A number of political ads claim that Kansas schools lost students during Gov. Sam Brownback’s administration.
Enrollment in Kansas has dropped in five of the last seven years under Governors Brownback, Colyer and Kelly.
Under Brownback, there was a minor drop of 99 students statewide in the 2015-2016 school year, and slightly more than 3000 students statewide (about 0.66%) in 2016-2017.
Under Gov. Laura Kelly schools lost 27 students statewide in 2019-2020 (including the beginning of COVID) and nearly 14,000 students (almost 3%) in the full year of COVID in school year 2020-2021.
The plots looks the same, but the numbers in the chart above are slightly different from those in the analysis of Expenditures Per Pupil in Kansas. KSDE reports the numbers here have not been audited.
Pupil-Teacher Ratio
Large ratio increases. The statewide Pupil-Teacher Ratio increased 2.74% to 14.6 pupils/teacher in school year 2009-2010 under Gov. Parkinson, and 3.95% to 15.1 to pupils/teacher in school year 2011-2012 under Gov. Brownback.
Large ratio decrease. The 2020-2021 2.93% decrease in Pupil-Teacher Ratio to 14.8 pupils/teacher under Gov. Kelly was caused by a nearly same 2.92% decrease in FTE enrollment. The drop of nearly 14,000 students that year was caused by COVID-19.
School District Staffing
Here’s the data for the plot below:

Licensed Personnel. Drops in licensed personnel have occurred only three times in the last 14 years. The largest drop of 2.43% was under Gov. Sam Brownback, and the second largest drop of 1.94% occurred under Gov. Parkinson.
The largest increase of 1.75% occurred under Gov. Colyer in 2018-2019, with the second largest increase of 1.62% under Gov. Kelly in 2021-2022.
PK-12 Teachers. The large 2.43% drop in licensed personnel in 2011-2012 was smaller than the 3.56% drop in PK-12 teachers that are included in the pupil-teacher ratio. In other words, non-teaching staff were retained at a higher rate that year than teachers in the classroom.
In 2021-2022 there was a 1.62% increase in licensed personnel, but a drop of 0.28% in teachers in the classroom when . How does Gov. Kelly explain this?
Special Education Teachers. The number of special ed teachers has remained fairly flat but with a 4.19% drop in 2014-2015 under Brownback, and a 5.52% increase in 2021-2022 under Gov. Kelly.


