Analysis of Expenditures Per Pupil in Kansas School Districts
A look at full-time equivalent student populations and expenditures per pupil for years 2007-2021
The Kansas Department of Education reports expenditures per pupil by school district every year, and the number of full-time equivalent (FTE) students benefiting from these expenditures. Data and charts of this information are shown below.
KSDE breaks the expenditures down by theses categories:
Capital Outlay
Bond Interest
All Others
Reproducible Research
Complete data provenance is provided. Instructions below show how to download the data from the Kansas Department of Education, or use files already downloaded and stored on GitHub. Electronic notebooks using the R language document all processing and analysis steps, which are also stored on GitHub. This article is an overview of the process.
Data files and R Studio Notebooks can be found on GitHub in the Expenditures-per-Pupil folder.
Authoritative Data Source
Start on this Kansas Department of Education Data Central page:
KSDE Data Central - Kansas Education Reports
Select School Finance Reports Warehouse.
Make these selections:
Select report format: Excel
Report type: Expenditures Per Pupil
Report Description: Shows the Total Expenditures per Pupil for each district, and state totals, as well as expenditures per pupil for the Capital Outlay Fund, Bond & Interest Fund and All Other Funds combined. See Report Summary for more information.School Year: pick one “2007 - 2008” through “2020-2021”
Press “Display Report”
Save each of the 14 Excel files using a name such as Expenditures-per-Pupil-yyyy-yyyy.xls
The analysis process below involves:
Combining all the yearly Excel files together to create a single “wide” dataset showing values by school year by school district.
Exploring each key field using density plots to look for consistency in the data, and possible outliers.
Displaying state summary of time series of Total Expenditures Per Pupil over school years 2007-2008 through 2020-2021.
Data Exploration
Notebook 10-Expenditures-Per-Pupil.html shows explorations of the data and creation of several time series graphics.
Section 2.4 of the Notebook shows the utility of the map_dfr function from the R purrr package in reading and combining all 14 Excel files in one step, to enable analysis of all years. Section 2.5 shows Sample Data.
Density plots
A quick way to evaluate the distribution of a quantity, and sometimes determine if there are outliers, is through a density plot, which is similar to a histogram. This step is to ensure the quality of data and to better understand nuances in the data.
The goal is to understand the consistency, variation and extreme values, and not-so-much the number of school districts in any particular interval.
If a density plot is “normal,” then mean and standard deviation statistics are meaningful. If not, non-parametric statistics like median and interquartile range are more appropriate. Interpretation of the “log normal” data is more complicated because of the huge range that can be present.
The density plots below are from the most recent school year of data, 2020 - 2021.
See Sections 3 and 4 in the Notebook.
Full-Time Equivalents
School districts in Kansas range from very small to very large. The log-scale shown above accommodates the wide range in a single plot, which is roughly log-normal.
See this Excel file that shows FTE values by year for all school districts:
Expenditures per pupil
Capital Outlay
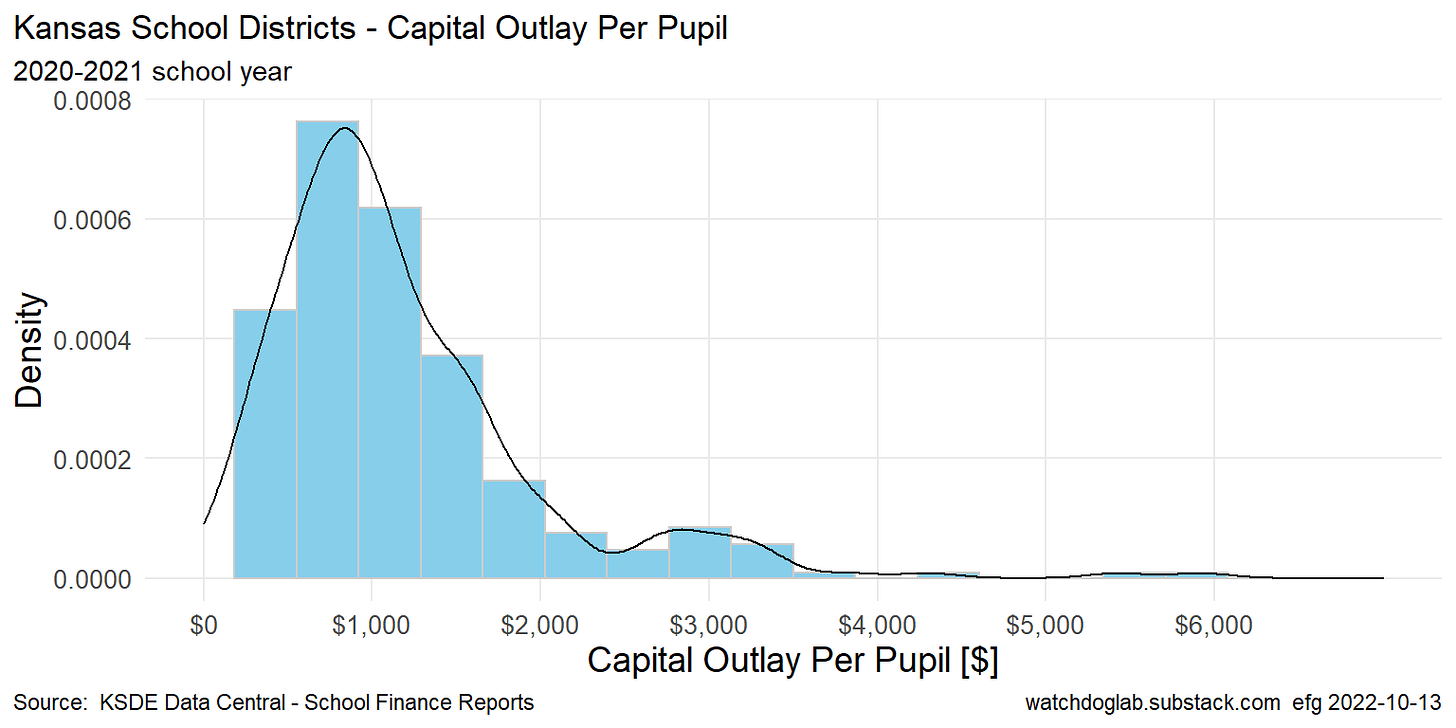
The distribution is a bit skewed. Generally, Capital Outlay expenditures in most school districts are less than $1000 per pupil.
Bond Interest
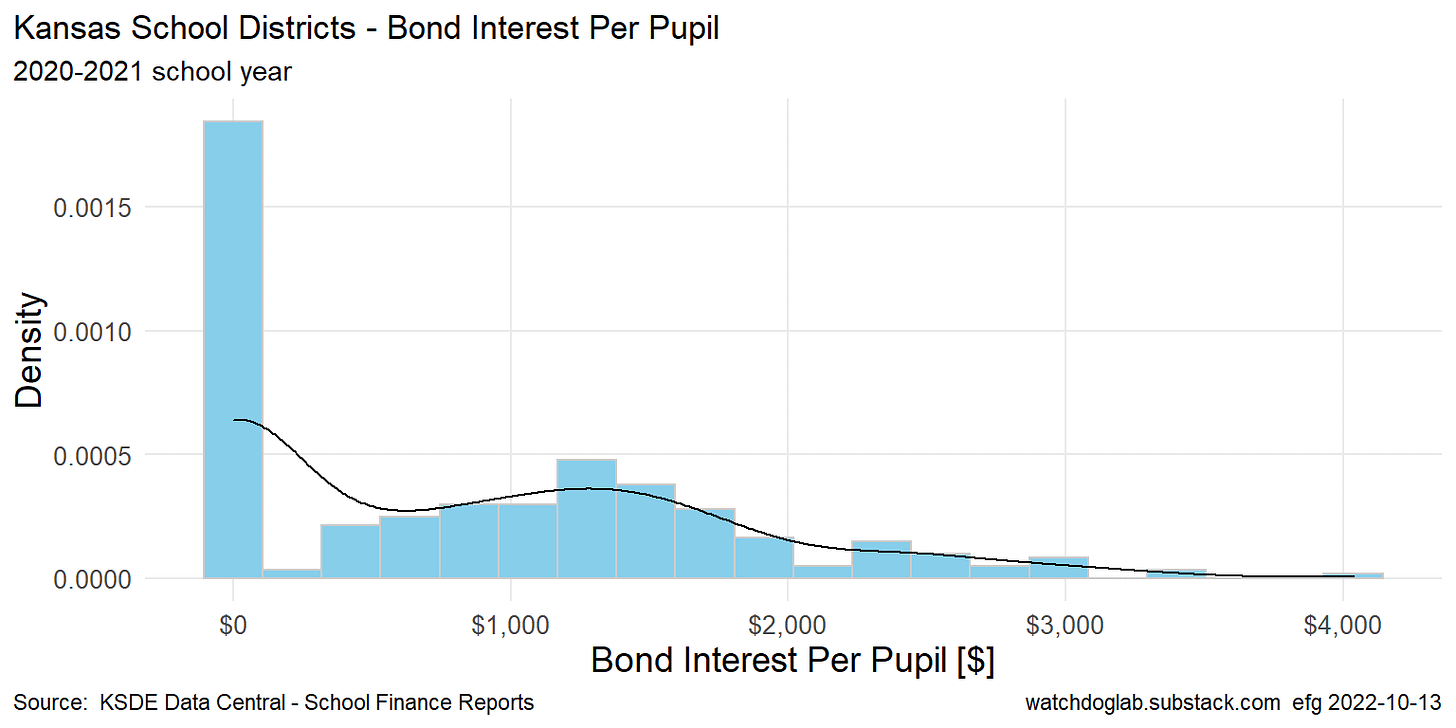
Most school districts shown $0 Bond Interest per pupil, but in some districts this value can be several thousand dollars.
All Other Funds
“Other Funds” are typically about $15,000 per pupil but can be less than $10,000 and more than $25,000 in some districts.
Total Expenditures
The KDHE Report summary shows everything included in Total Expenditures in 2020-2021:
Reported values are total expenditures divided by FTE enrollment.
The density plot below shows a typical Kansas pupil benefits from about $16,000 of school spending, but the range across school districts is from about $10,000 to $25,000 per pupil.
See this Excel file that shows Total Expenditures Per Pupil by year for all school districts:
Additional files, including the original KSDE data files, can be found on the GitHub site.
Time Series Showing Changes Over Time
See Notebook Section 5.
Here is the data for the next two graphics:
Full-Time Equivalent Enrollment
A number of political ads claim that Kansas schools lost students and spent less money during Gov. Sam Brownback’s administration.
Under Brownback, there was a minor drop of about 99 students statewide in the 2015-2016 school year, and nearly 3000 students statewide (about 0.66%) in 2016-2017.
Under Gov. Laura Kelly schools lost 27 students statewide in 2019-2020 (including the beginning of COVID) and nearly 14,000 students (almost 3%) in the full year of COVID in school year 2020-2021.
Total Expenditures Per Pupil in Kansas Schools
During Brownback’s administration schools spent more per student in all years, except 2015-2016 when they had about $100 less per student. The drop in spending during school year 2009-2010 under Mark Parkinson was nearly 2.5%, which was three times the drop in the one year of Brownback.
Gov. Kelly can boast spending is up nearly 7% in school year 2020-2021, but in that year there was also nearly 3% fewer students.
Breakdown of Total Expenditures Per Pupil in Kansas Schools
KSDE breaks down the total expenditures into three parts: Capital Outlay, Bond Interest, and All Others.
Each of these three parts appears to be slowly increasing every year.
Related


Updated 2022-11-28


