Understanding Kansas Help America Vote Verification data
Plots of Kansas HAVV data show several curiosities
A recent WatchdogLab article gave general information about Help America Vote Verification (HAVV) data across the country. This article focuses on HAVV data for Kansas.
Kansas voter registration
Locations where qualified Kansans can register to vote, or update voter registration information, include:
The Kansas Department of Revenue and its nearly 120 driver license exam stations.
Online the KDOR and Secretary of State registration portal.
On-site voter registration with one of the 105 county election officials (clerks or commissioners) .

Other options include
Mailing a national mail voter registration form to the Secretary of State, which is forwarded to a county clerk.
Online using a Kansas “non-profit in the middle” site between the voter and the election office provided by Blueprint Kansas doing business as KSVotes.org. These online forms are emailed directly to a county clerk’s office.
In theory, the law says the HAVV process is intended only for new registrations without state-issued IDs, but there is evidence the process was applied to the entire Kansas voter roll in 2020-2021.
HAVV Data
Total Transactions by Week
An HAVV “transaction” with a proper verification code from Social Security can result in a new registered voter, sometimes after additional checks are made by the election office.
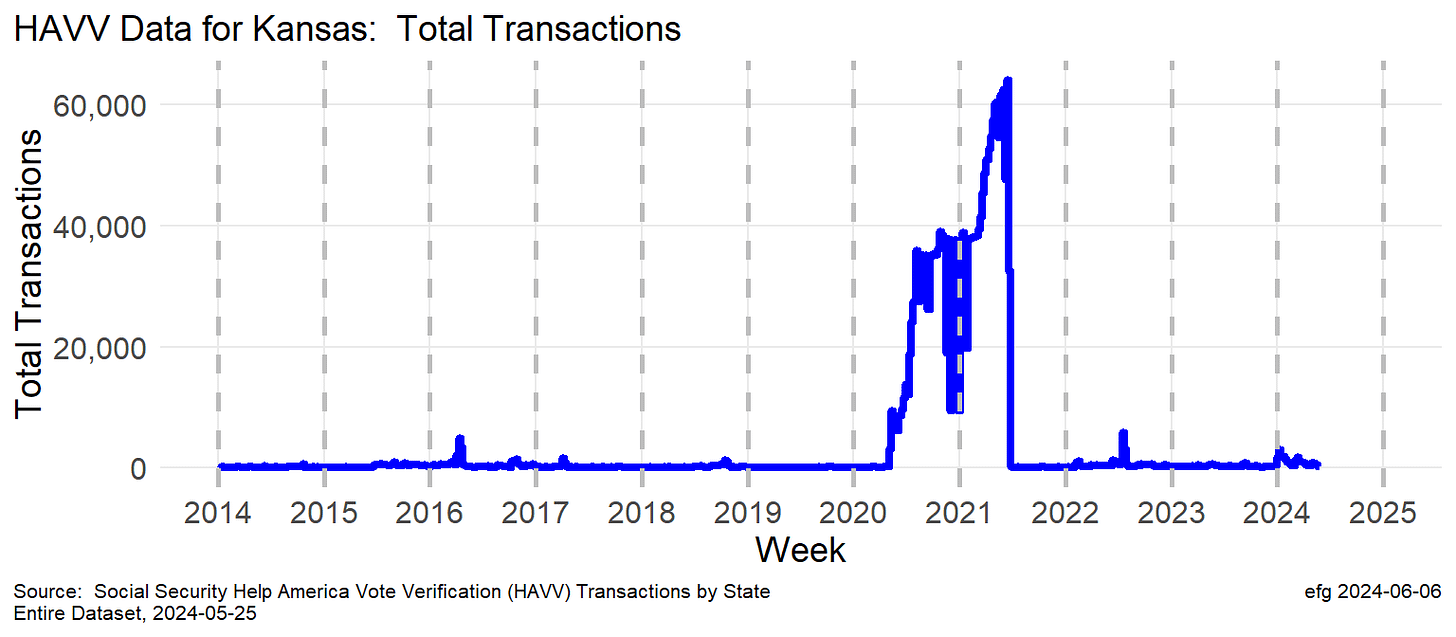
The total Kansas HAVV transactions for 2015 were 16,433, while 2023 showed a similar number with 17,158. So, the weekly transaction rate averages about 325 per week.
There have already been over 20,000 HAVV transactions in 2024.
What this plot shows
The blue line shows points for the number of total HAVV transactions for each of the 543 weeks from Jan. 4, 2014 through May 25, 2024.
There are some minor “spikes” in 2016 and 2022, but one large wide spike from mid-2020 through mid-2021 dominates the plot.
A software update might explain this huge number of transactions -- the only two "valleys" in this spike were over Thanksgiving and Christmas weeks.
From mid-2020 through mid-2021 there were over 2 million HAVV transactions. If one subtracts about 20,000 for a “normal” year (like 2014 or 2023), the resulting number is approximately the number Kansans registered at that time.
Was the whole Kansas voter file processed through HAVV starting in mid-2020? But why was that done since HAVV supposedly is only for new applications?
Percent Nonmatching Transactions

What this plot shows
The red line shows the percentage of transactions for each of the 543 weeks that did not match information from Social Security.
This red line shows two curiosities:
While processing the whole Kansas voter file in 2020-2021 new records were set both years: 26.5% of transactions did not match in 2020. 26.7% of transactions did not match in 2021.
What explains the spike in non-matches in 2023 when 30.7% of HAVV transactions matched no Social Security records last year. The weeks of May 6 and May 13, 2023, showed about 73% of transactions did not match. Four other weeks in 2023 had mismatch rates of about 62%.
The big question: is this high rate of failure to match Social Security records observed statewide, or only at specific Kansas locations?
Local election offices use the HAVV Social Security match indicators and other information to decide whether a voter registration applicant qualifies to be a voter.
For transparency all states should supplement statistics to show how many HAVV transactions turn into qualified voters.
Percent Deceased in Matching Transactions

What this plot shows
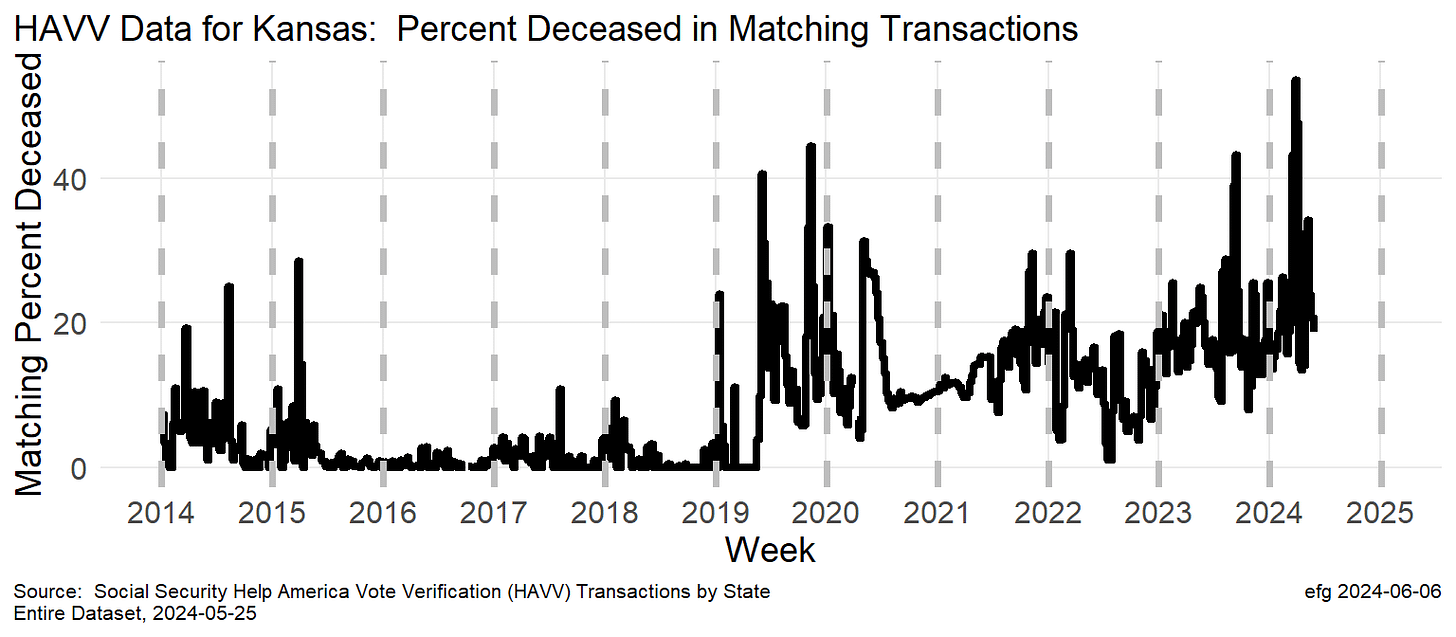
The black line shows the percent deceased in the matching transactions for each of the 543 weeks.
During the week of March 23, 2024 the HAVV data show Kansas had 1067 total transactions with 835 matches -- so 232 or 21.7% did not match that week (red line in plot above).
But of those 835 matches, the HAVV data show 447 were "Single Match Deceased", which indicates 53.5% of the matches were possibly deceased. Should such a high deceased match percentage trigger some additional investigation?
Curiosities:
Why was the percent deceased in matching records 53.5% during one week March?
Why is this rate for 2024 so far setting a new yearly record of over 23% when the overall rate since 2011 is only 11.5%?
Why has the deceased rate among Social Security matches been trending upward since early 2019?
The big question: is this high rate of deceased in the matches to Social Security records observed statewide, or only at specific Kansas locations?
The “big question”
By design the HAVV process restricts the information on where a voter application was completed to prevent any adverse actions against applicants.
But are anonymous HAVV statistics available that show a breakdown for each of the 105 counties, or each of the nearly 120 driver license stations?
Can we learn which counties or license stations have high percentages of HAVV nonmatches or high percentages of deceased in the HAVV matches?
Kansas Open Records Act Request
A KORA request was sent on April 30 to the General Counsel of the Kansas Department of Revenue asking for these documents:
Copy of any active “memorandum of understanding,” or similar documents with agreements, between the Kansas Department of Revenue and the Social Security Administration about the administration of the Help America Vote Verification (HAVV) data.
Copy of any active “memorandum of understanding,” or similar documents with agreements, between the Kansas Department of Revenue and the Kansas Secretary of State’s office about the administration of the Help America Vote Verification (HAVV) data and transfer of data to ELVIS (Election Voter Information System).
Any reports from 2023 through current April 2024 (preferably in a csv or Excel file) showing a breakdown of the statewide numbers on the national HAVV site … but by individual Kansas drivers license location.
A preliminary response to this KORA request said the reviews were not yet complete.
On June 6 the HAVV summary data for Kansas and plots from this article were sent to the Kansas Department of Revenue with a request for a meeting to discuss.
There has been no response to the request to meet.
Any answer to the big question is not yet known.
Kansas HAVV Data in Excel
All data used in the plots above are in an Excel file that can be downloaded:
See more files and technical details in GitHub repository.


Definitely some concerning trends.