Political Ads for Gov. Laura Kelly and Congresswoman Sharice Davids distort reality about school finance
What were the actual total expenditures per pupil when Brownback was governor?
Many campaign ads by candidates, political parties and non-profit groups denigrate former Kansas Gov. Sam Brownback for “destroying” education funding in Kansas while he was governor. But what is the truth?
One of Laura Kelly’s ads claims “Sam Brownback’s cuts had left our schools dangerously underfunded.”
Sharice Davids claims Amanda Adkins was responsible for “helping pass the disastrous [Brownback] tax scheme that devastated Kansas schools. ”
The Kansas Values Institute claimed Brownback’s actions “caused deep cuts to schools” in trying to link Derek Schmidt to Brownback.
If Brownback affected school finance as much as these ads claim, shouldn’t that be reflected in the historical data from the Kansas Department of Education?
Shouldn’t a “deep cut” or something “disastrous” be obvious in charts about school finance?
Show me the data
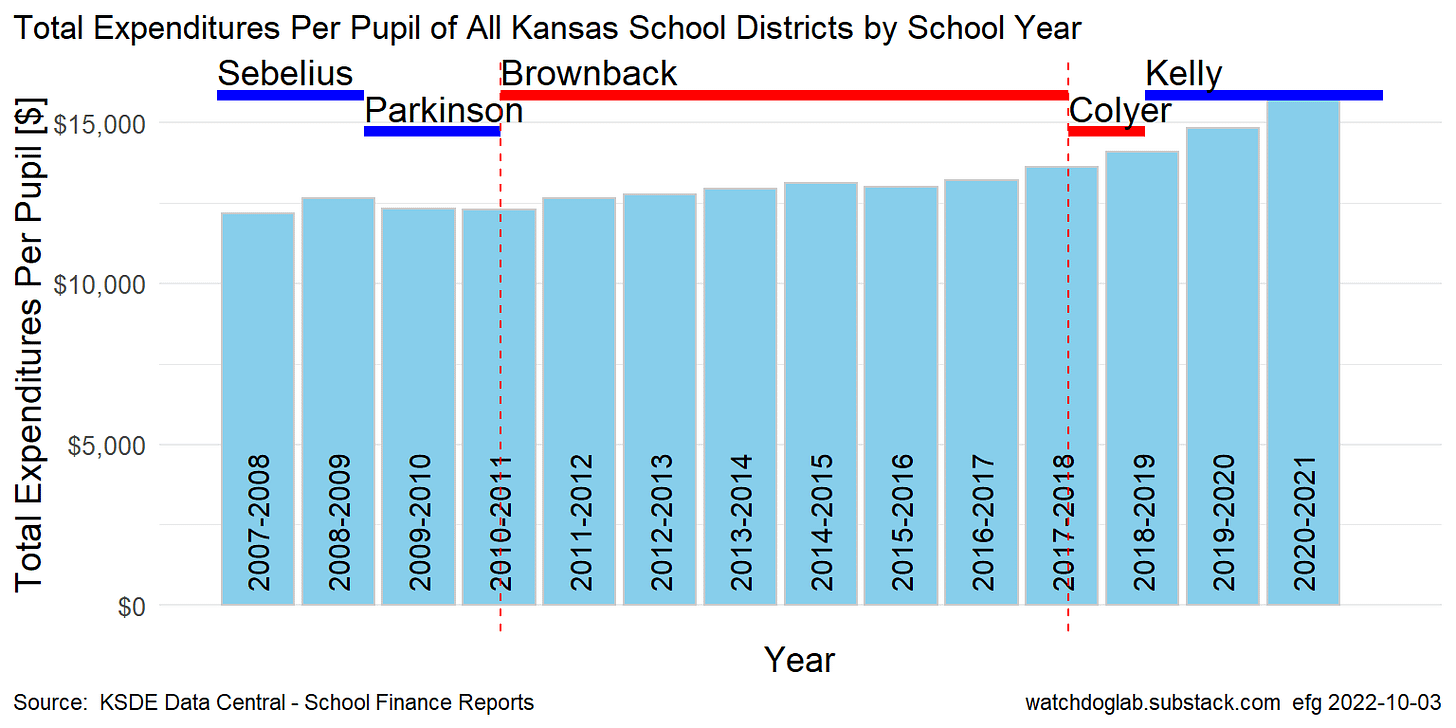
The chart below using data from the Kansas Department of Education shows no “deep cuts” in overall total expenditures per pupil while Brownback was Governor.
In fact, in all years but one of Brownback’s administration there was increased spending per pupil in Kansas.


The expenditures per pupil numbers vary widely across the nearly 300 Kansas school districts. The data show USD 218, Elkhart School District, in Morton County, only spent $6803 per pupil in 2020-2021. USD 468, Healy Public Schools, in Lane County reportedly spent $32,630 per pupil at the other extreme.
Download this Excel file to see the history of expenditures per pupil at each of the nearly 300 Kansas school districts from 2007 to 2021.
Brownback’s push to hold school districts accountable
School districts report their “Cash Balance” to the state every July 1.
KSDE data show that in 2007 all the school districts collectively had about $1.2 billion in their cash balances, but that grew to a staggering $2.4 billion in 2021. The numbers for 2022 are not yet available.
The chart below shows Brownback was fiscally responsible in not allowing school district cash balances to grow under his watch, unlike any of the other governor.

Has Gov. Kelly questioned why four Kansas school districts need over $100 million in their cash balance? In particular, why does USD 259 in Wichita need a cash balance of over $230 million?
Download this Excel file to see the history of school district cash balances from 2007 to 2021.
Reproducible Research
All data and programs used in analysis are online in this GitHub repository.


