Democratic Congressional Campaign Committee uses false and misleading statements to attack Amanda Adkins in KS-03
Democratic Congressional Campaign Committee uses false and misleading statements to attack Amanda Adkins in KS-03
Show Me the Data!! DCCC uses Fear, Uncertainty, and Doubt to confuse voters

Like many political ads, DCCC video ads in support of Sharice Davids and against Amanda Adkins are not designed to educate voters and promote civic discourse. Rather the DCCC ads are designed to distort the truth, mislead and confuse voters with fear, uncertainty and doubt.
DCCC is certainly not alone in promoting such ads, but benefits from a biased media that rarely researches false and misleading claims, especially using data analysis.
This article looks at DCCC claims attacking Amanda Adkins and shows data from an authoritative source, in this case the Kansas Department of Education, to refute those claims.
Why is DCCC focusing on a state issue in a federal election? Perhaps DCCC is saying “look over there” instead addressing pressing concerns of voters, like high cost of living/inflation, the economy, fuel prices, immigration, unifying the country, …?
Ads Paid for by DCCC
The Kansas Institute for Politics at Washburn University provides a repository of Kansas political ads. This is a great site to review political ads.

Both DCCC ads listed on the Washburn site as “DCCC (Pro-Davids, Anti-Adkins)” have similar content, but the discussion below focuses on the first ad.
DCCC claim: “Drained Funding for Schools”
“Adkins helped Brownback pass tax giveaways to the rich that decimated Kansas schools; teacher layoffs; … larger class sizes; …”
Three DCCC claims can be addressed using information from the “Data Central” maintained by the Kansas Department of Education. [I don’t know where to find authoritative data quickly to prove or disprove two DCCC claims that “school districts to close early” or about “school cancellations.”]
If you are a farmer or a business owner you are one of the “rich” being attacked in this ad. Brownback’s “experiment” was about lowering taxes for all businesses to stimulate sustainable economic growth for a better economy — and to fund Kansas government including schools. Brownback was also pushing for more fiscal accountability in school districts, which was not popular.

Show me the data!!
While Brownback’s experiment did not play out as expected, the data show Kansas schools were not “decimated” under his administration.
Two measures of Kansas school finance do not show “drained funding for schools” while Brownback was governor. Consider these charts …
Total Expenditures Per Pupil
Data from KSDE reflects general increases in total expenditures per pupil most years, including during Brownback’s administration. Which year or years in the chart represent “decimated”?

School District Cash Balance
Kansas school districts report their total “Cash Balance” to the state every July 1.
KSDE data show that in 2007 all the school districts collectively had about $1.2 billion in their cash balances, but that grew to a staggering $2.4 billion in 2021.

The chart shows Gov. Sam Brownback was fiscally responsible in not allowing school district cash balances to grow under his watch, unlike any other governor.
Has Gov. Laura Kelly questioned why four Kansas school districts need over $100 million in their cash balance? In particular, why does USD 259 in Wichita need a cash balance of over $230 million?
Data Details

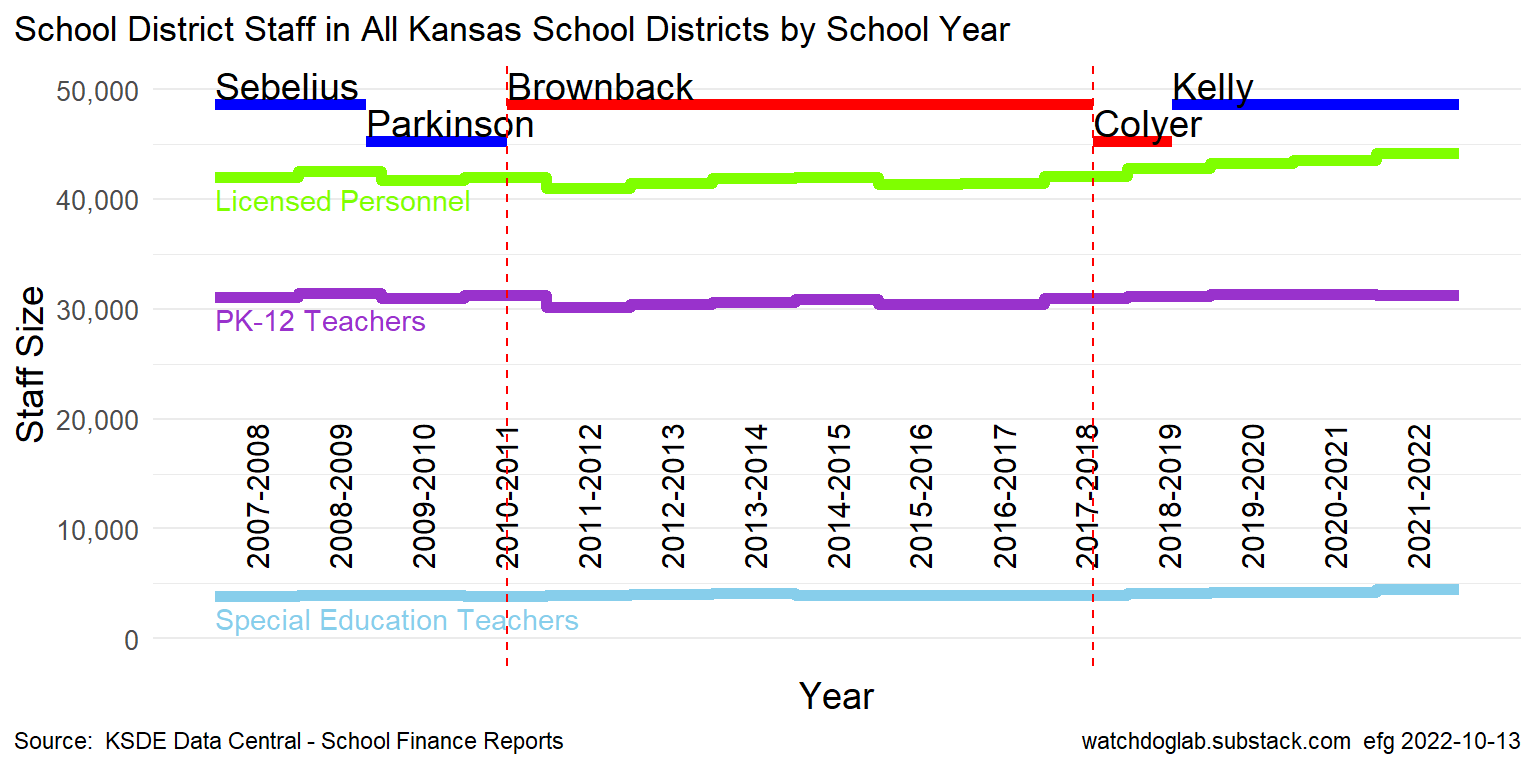
DCCC claim: “Mass Teacher Layoffs”

Show me the data!!
The numbers of PK-12 Teachers and Special Education Teachers are relatively flat across all years.
The number of Licensed Personnel has been trending slightly higher the last few years. Why is that trending upward when those numbers do not affect the pupil-teacher ratio? [Only the PK-12 teacher numbers are used in that ratio.]
Data Details
DCCC Claim: “Larger Class Sizes”

Show me the data!!
Data available to the Washington Post on 7/30/2014 (cited by DCCC) would show the Pupil-Teacher Ratio did increase from 14.6 pupils/teacher in school year 2010-2011 to 15.1 in 2011-2012. DCCC’s claim is technically true, but how impactful is an additional half-student (or less) to class size?
In other words, how impactful is having roughly half the classes the same size, and half the classes with one additional student? How can that impact be measured and is it significant?
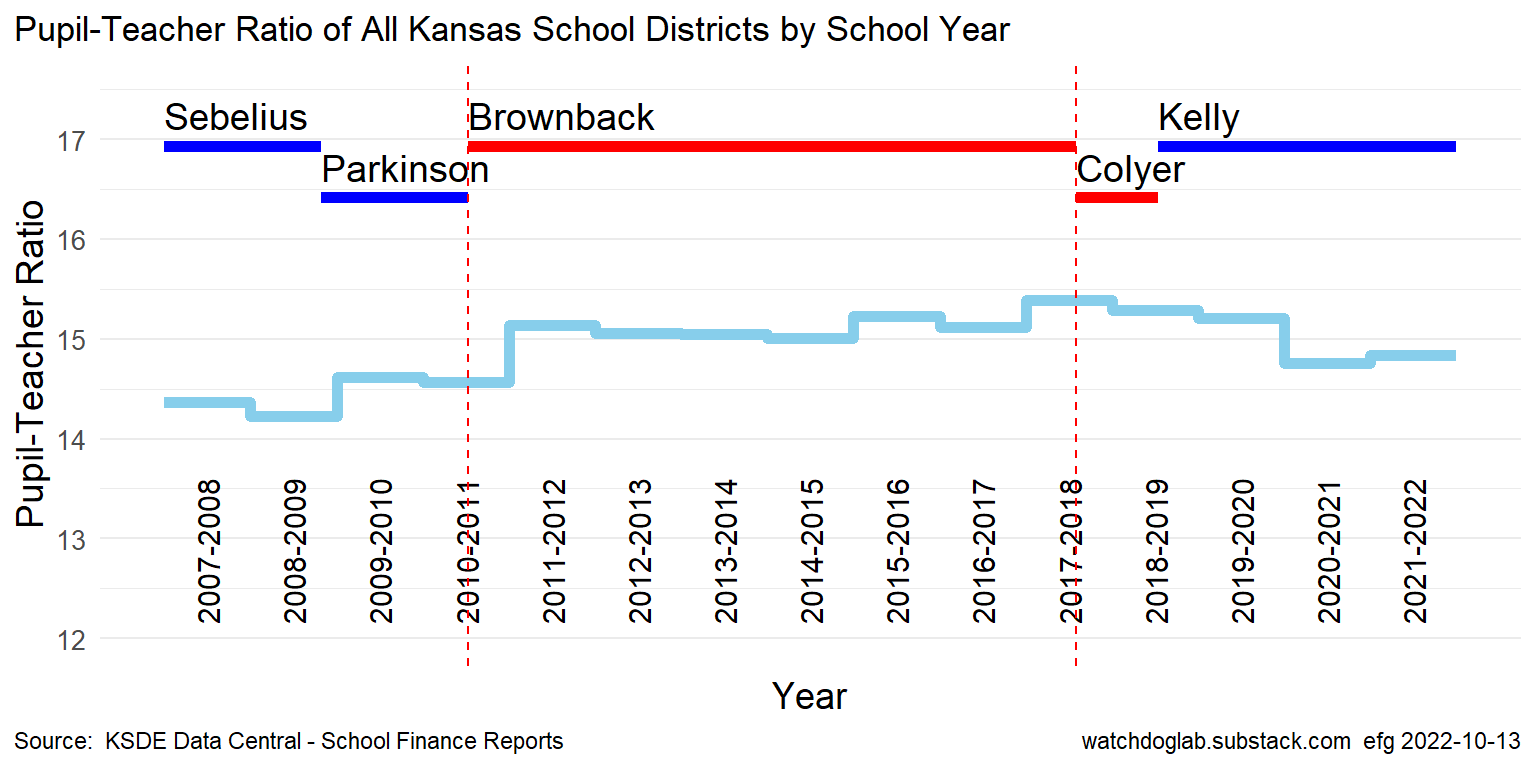
Large ratio increases. The statewide Pupil-Teacher Ratio increased 2.74% to 14.6 pupils/teacher in school year 2009-2010 under Gov. Parkinson, and 3.95% to 15.1 to pupils/teacher in school year 2011-2012 under Gov. Brownback.
Large ratio decrease. The 2020-2021 2.93% decrease in Pupil-Teacher Ratio to 14.8 pupils/teacher under Gov. Kelly was caused by a nearly same 2.92% decrease in full-time equivalent enrollment. The drop of nearly 14,000 students that year was caused by COVID-19. In this case, lower class sizes are not good with many students now absent from school.
Data Details
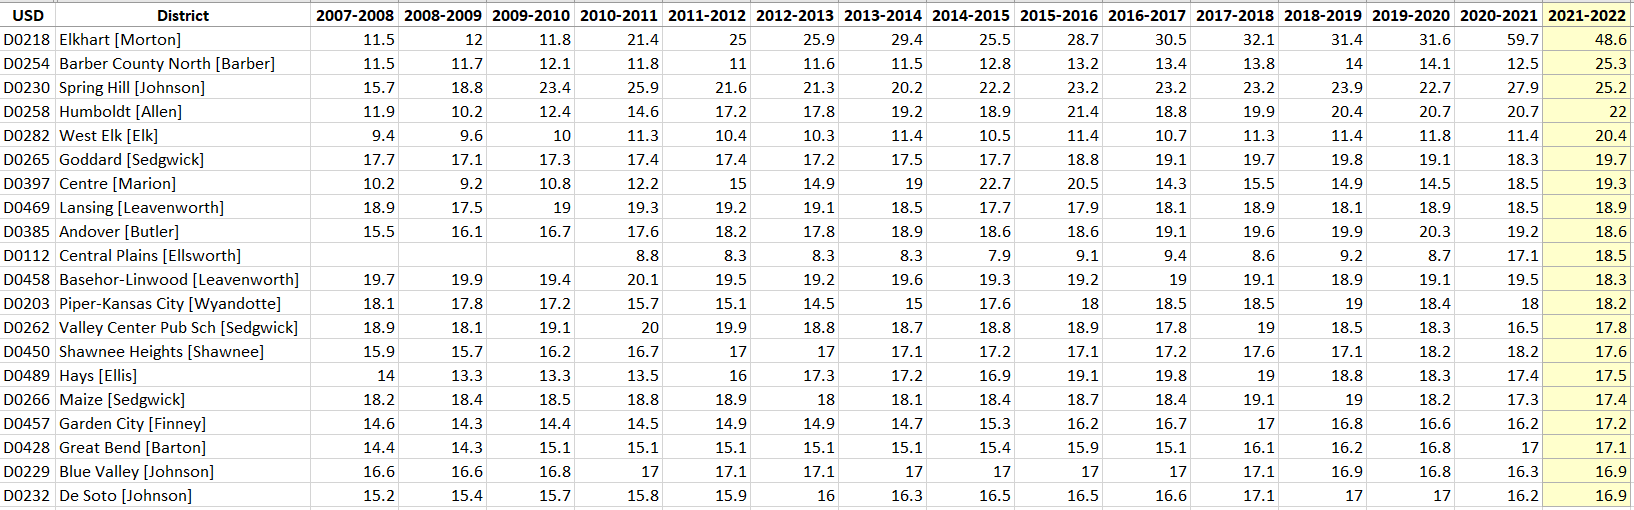
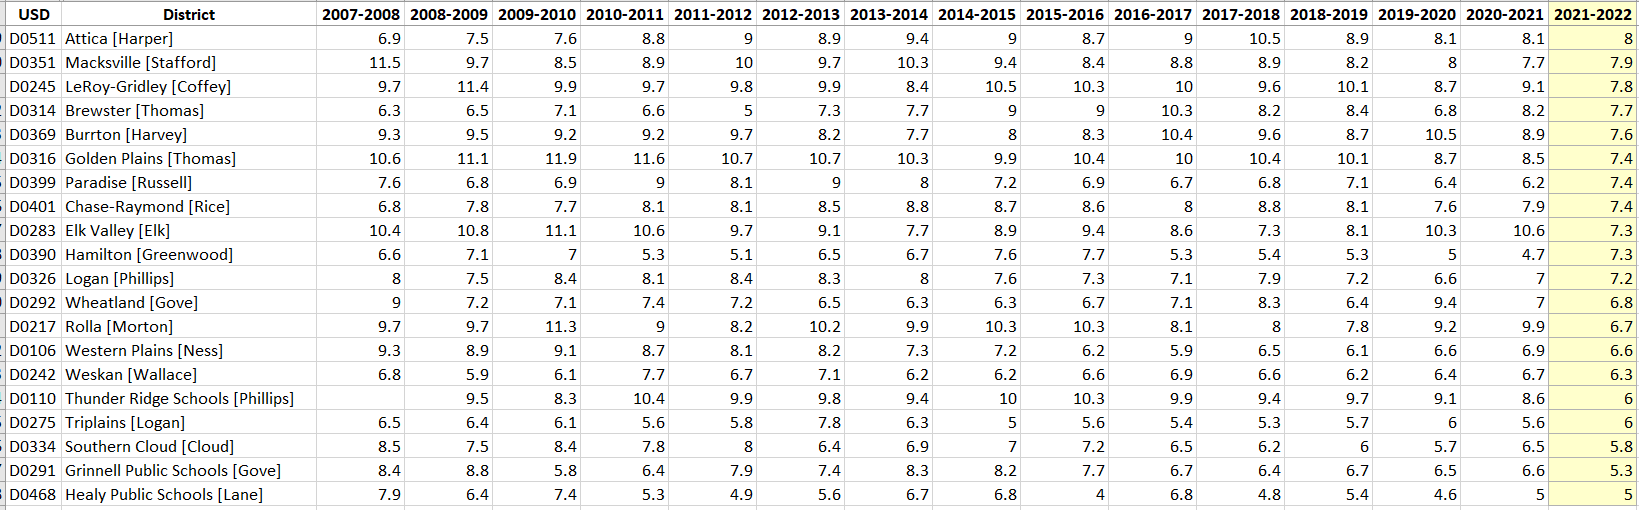
Pupil-Teacher Ratios vary considerably across the roughly 300 school districts in Kansas. Citing single statewide numbers may not reflect what is happening in a particular school district.
This file shows pupil-teacher ratio values for the nearly 300 school districts in the state over school years 2007-2008 through 2021-2022.
Here are tables for the school districts for the largest and smallest Pupil-Teacher Ratios in school year 2021-2022:
DCCC time-order fallacy?
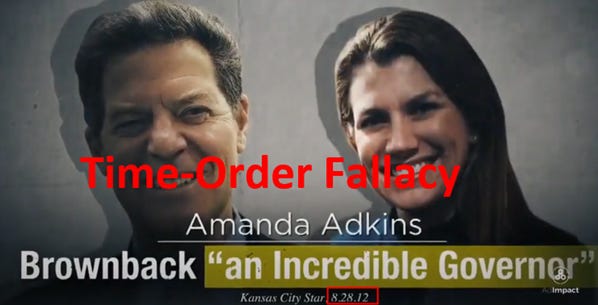
After claiming Brownback impacted schools five different ways with citations from 2014, 2015, 2017, DCCC tried to link Adkins to Brownback and his actions as Governor through a quote made earlier in time?
Adkins called Brownback “an incredible governor” in 2012, which was two to five years before DCCC’s citations about Brownback’s policies that encouraged schools to be more fiscally responsible.
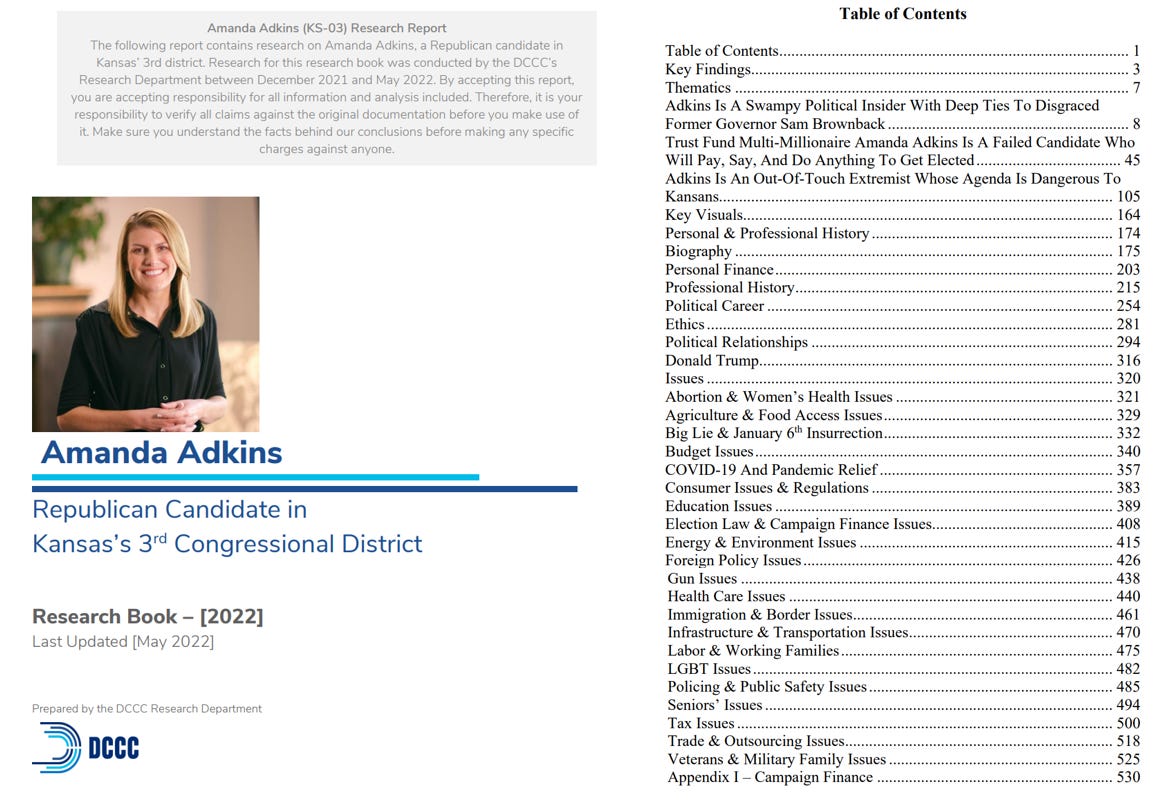
DCCC Adkins Dossier
The DCCC “Research Report” on Amanda Adkins likely started in 2020, but by May 2022 swelled to 543 pages.
Sadly, the purpose of this report was to be the basis for fear, uncertainty and doubt to confuse voters. Many issues of importance to voters were researched as shown in the Table of Contents below, but were not the focus of DCCC’s ads.